CoinTracking Documentation - How To Start with CoinTracking
Starting with CoinTracking
CoinTracking is a portfolio manager for tracking of all trades of digital currencies.
It provides useful analysis for trades, prices, volume, profit, loss and the value of all your coins.
Furthermore CoinTracking offers a specially developed tool for the annual tax return, among other things according to the standards of capital gains, FBAR, Form 8949 and the German Income Tax Act.
Trades can be entered in many different ways.
Either manually, by an import from exchanges or fully automatically via APIs.
The user decides what data should be tracked by which exchange.
In the following chapters you will learn how you can integrate your trades and what benefits CoinTracking provides thereby.
Click above on the links to jump directly to the desired chapter.
How do I enter my trades?
After you log in at CoinTracking, the first step is to enter your coins, so CoinTracking can track them.
Under
Transactions in the navigation, you will find all functions to do this.
Click in the navigation bar on
Transactions.
You are now on the main page for tracking of your coins.
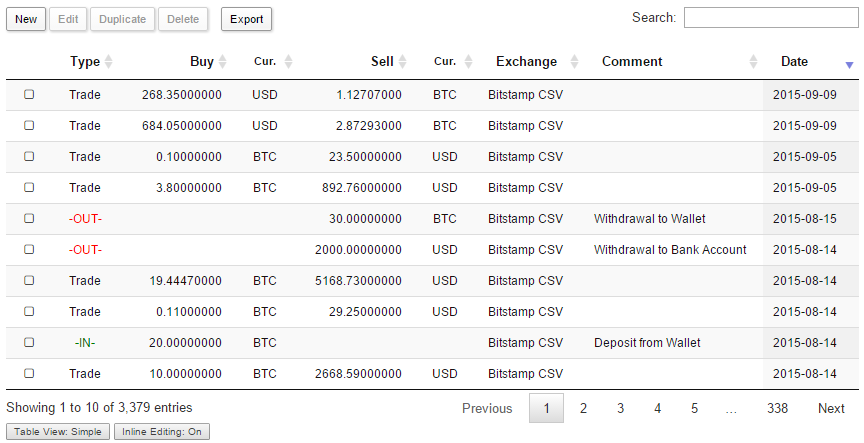
You will notice that your Trade Table is empty. Now it is time to fill in your trades. There are three different ways to do so.
1. Transactions manually
With the manual method, it's very easy to enter your trades.
Click on the
New button to create a new trade.
Did you, for example, bought 2 BTC for 500 USD on October 10th 2015, then put in the following:
- Buy 2
- Buy Currency: BTC
- Sell: 500
- Sell Currency: USD
- Date: 2015-07-10
After saving your first trade appears in the Trade Table .
Congratulations! You've just created your first trade.
You can edit all your trades directly in the table, or by selecting a trade and clicking on
Edit.
Hit Enter or the arrow Button to save your changes. Press ESC or click outside the field to discard your changes.
Selecting a trade and clicking on
Delete, will remove this trade.
You can select multiple rows at once (even across multiple pages) using SHIFT + CLICK or CTRL + CLICK.
You can comment every single trade with a note. Both fields,
Comment and
Group are optional and only for your convenience.
All data is searchable and sortable. You can find a detailed trade table under
Reporting ->
Trade List
2. Upload trades from exchanges
CoinTracking support a large amount of well-known exchanges, of which your trades can be transferred directly.
To do this, click below the Trade Table on the logo of an exchange, to start the Exchange Importer.
Follow the instructions on the next page to upload your trades.
Trades that have been imported from exchanges are marked with the name of the Exchange in the Trade Table. You can search or sort after that exchange name in the table.
3. Automatic API Importer
With these importers you can monitor your trades or your BTC Wallet automatically. The system checks every few minutes your trades and adds them automatically into your account. Click on the logo of an exchange or on BTC Public Address and follow the instructions to set up the API Importer.
Which analysis offers CoinTracking?
Dashboard
Let's start with the
Dashboard. Here you can find all important information at a glance.
This includes the summary of your coins, the value per coin, your expenses, your profit or loss, your trades, your exchanges and much more.
If you have just entered trades, you will notice, that in the lower right corner, a message appears.
Click on the link in the message to generate your data.
The system will calculate the balance of all your trades per day and the profit / loss per currency.
Depending on the number of trades and the time period, this can take a few seconds.
This procedure is only necessary if you have added new trades. After a few seconds the page reloads and displays your reports.
Reporting
In the Reporting tab you'll find a wide range of different analysis to your trades, which are explained in detail in this section of the documentation.
Trade Statistics
Click on
Statistic Chart to see numerous analysis of your trades.
You can find many charts to your profit or loss, your value per currency, your amount of Coins, Profit / Loss per Coin and the Trade volume.
All charts were calculated according to your trades, you have entered under Coins entries, beginning on the day of your first trades, and end at the present time.
The charts are interactive. Individual datasets can be hidden by clicking in the legend and displayed again.
In addition, the charts can be zoomed by dragging, to highlight a certain period.
Trade List
Under
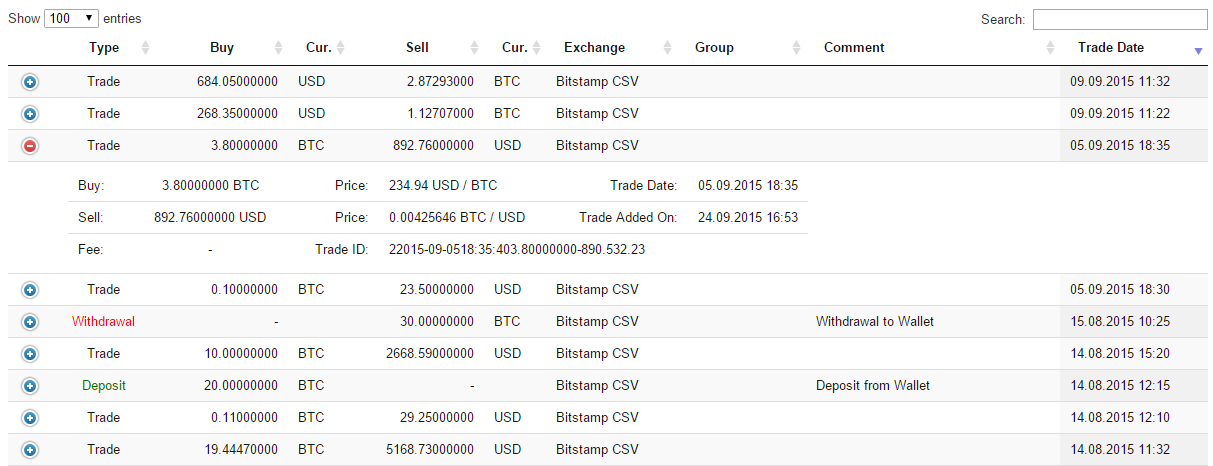
Trade list you will find a detailed listing of all your trades. All values shown are sortable and searchable.
Behind the blue plus button, there are even more information about this trade, as our calculated trading price per currency, the creation date and, if applicable, the Trade ID.
Daily Balance
The
Daily Balance adds and calculates all your trades to a particular day.
It thus shows the sum of your traded coins till this date, the value, the total value, the expenses and the profit / loss incl. an indicator.
These data can retrospectively determine the total stock of coins to a specific date in the past or at the present time (at the top).
Average Purchase Prices
The
Average Purchase page tells you, whether you would be at a profit (indicated by the color green) or a loss (indicated by red) if you would sell those particular coins right now.
This calculation involves the average purchase value for each cointype, calculated and compared with the current market value. Example: If you bought 10 BTC for $1000 ($100 per coin) 20 days ago, and Bitcoin is now worth $120 per coin (or $1200 for 10 BTC), you would make a profit of $200 if you sell right now. However, if the current price is at $90 per BTC, you would be at a loss of $100 ($1000 - $900) if you sell right now.
Now it gets more complicated. Lets say you have bought 10 BTC for $660. Then, a week later, another 5 BTC for $500, and then you have sold 7.5 BTC for $900. For how much you'd have to sell your BTC to make profit? This is the exact reason for using this table. The calculation is as follows:
Buy 1 (BTC amount * purchase price) + Buy 2 (BTC amount * purchase price) + ... - Sale 1 (BTC amount * purchase price) - ...
The result is an average value in dollars for all your BTC. If the current sell price is higher, the line turns green and shows how much profit you would made my selling your remaining Bitcoins. In the other case, the line will turn red and shows, how much you would lose if you sell everything right now.
The calculation for all other cointypes (LTC, NMC, TRC ...) works the same way.
Why is my purchase value negative?
Your purchase value may actually be negative if you've already made so much profit, that you can't make a loss anymore. Example: You buy 1,000,000 DVC for $100. 1 week later, 1,000,000 DVC is worth $400. You are selling the half for $200. You've made $100 profit so far and you still have 500,000 DVC left. In this case, your purchase value is negative, because you have gained more than your initial purchase. Even if the DVC price drops to 0, you can't be at a loss. You will always come out with a gain of $100 minimum.
Are the values correct?
Yes, but only if you have entered the correct information on the Transactions page. We recommend to double check your trades there, if the balance data looks inaccurate.
What else do I see on this page?
Below you will find an overview of all your transactions (all BTC purchases and sales), as well as other types of coins if you have any. The purchase value is always mapped and shows, how much profit or loss you made with every single transaction.
Tax Declaration Export
CoinTracking helps with the annual tax return of Bitcoins and other digital currencies.
CoinTracking calculates all your trades exactly to the cent and prepares them automatically according to several methods like FIFO, LIFO, HIFO, AVCO, ACB...
Open the
Tax-Report page and click on the
Open settings and create a new Tax Report button.
Select the tax year and further settings for the export like the method, filters, tax rates, etc.
When you're done, click on the button
Generate a new Tax Report now!. Before generating a new report, please make sure that all your trades are listed in CoinTracking correctly.
Once the report is ready, click on the
Load Report button to view the full report including your Capital Gains Report, Income Report, Donations and Gifts Report, Stolen and Lost Coins Report and the Closing Position Report
Our tool is designed to adapt to the laws, financial statements and forms of different countries, such as Capital Gains, FBAR, Form 8949, the German tax declaration under the Income Tax Act, and many more.
Research Area
CoinTracking provides a globally unique research area with numerous information about Crypto Coins.
In addition to analyzes and statistics about trades, profits and Coins, CoinTracking offers Price Charts for current market prices, trends and even forecasts.
User Statistics
CoinTrackings
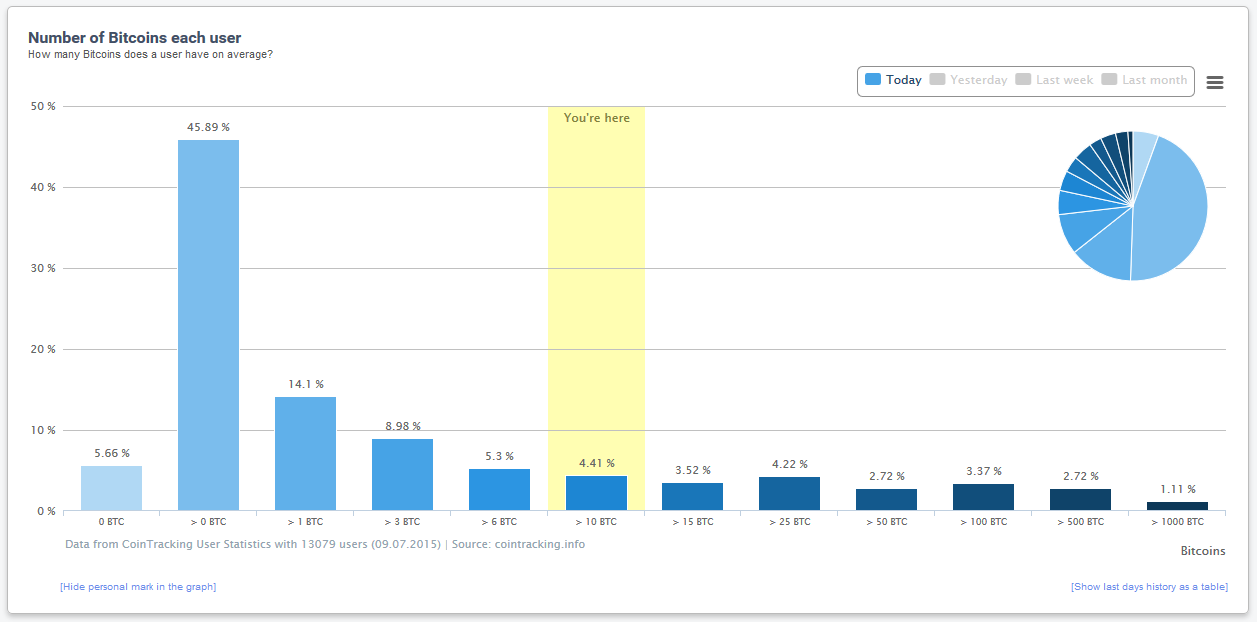
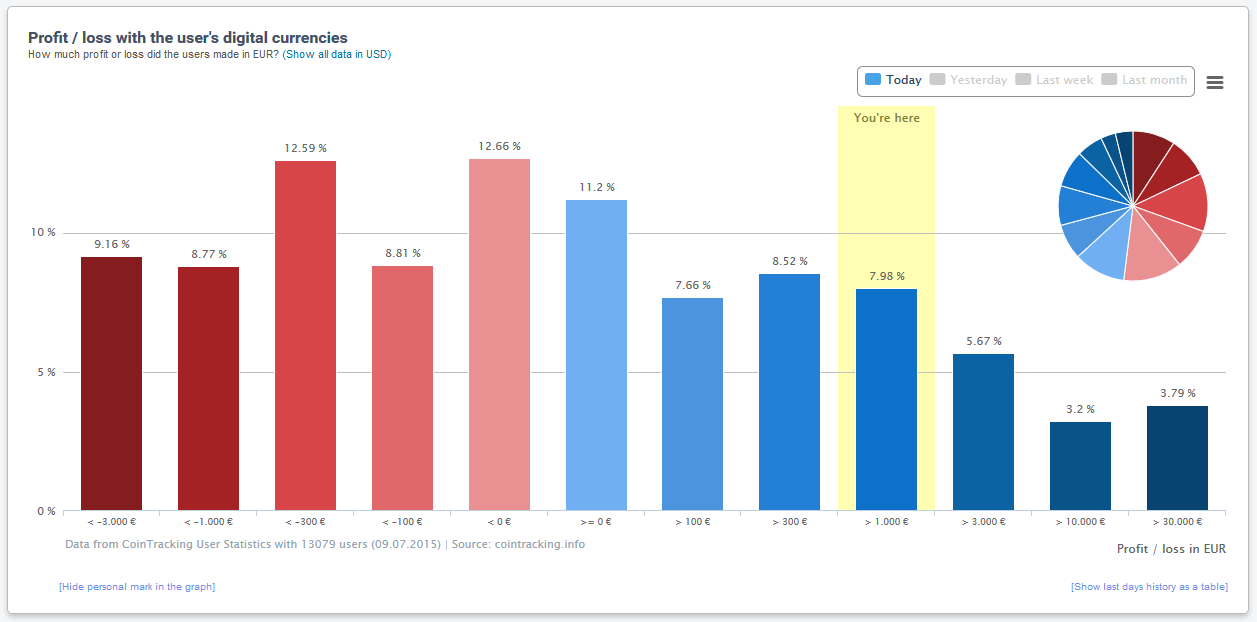
User Statistics summarize information about traded Coins in informative charts.
In those graphics you can identify which coins are traded mainly, how much Bitcoins users have on average, what value those coins have and the profit or loss range of all users.
The range in which you are, is highlighted in the charts. This highlighting can be hidden (for example, for an export of the graphics).
The values of yesterday, last week and last month can be accessed by clicking in the legend.
Also you can enable the history data for each chart as a table.
Coin Charts
The
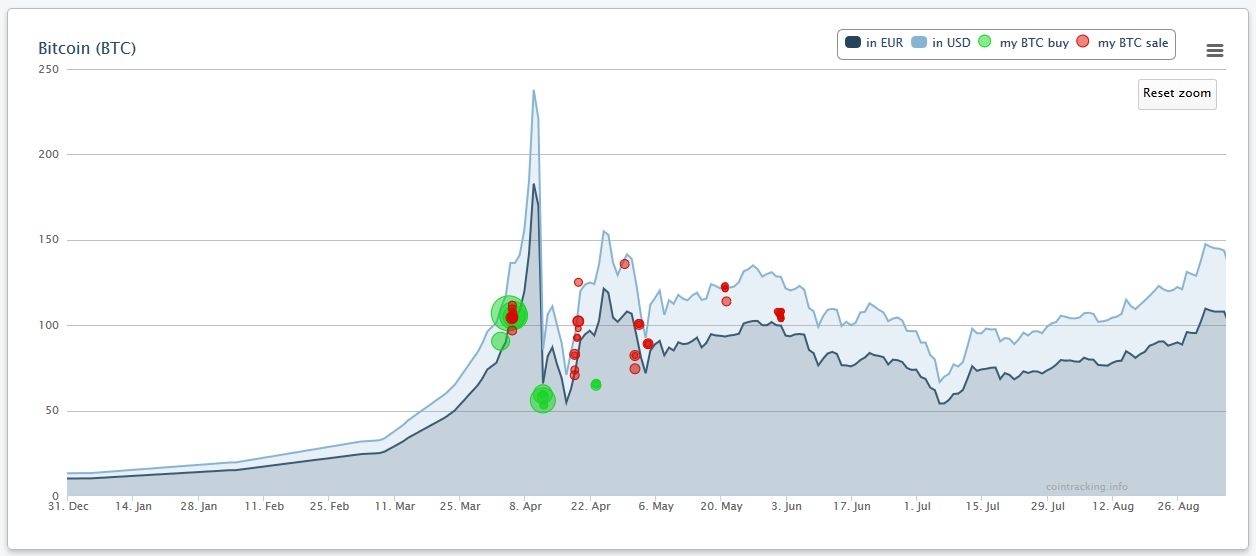
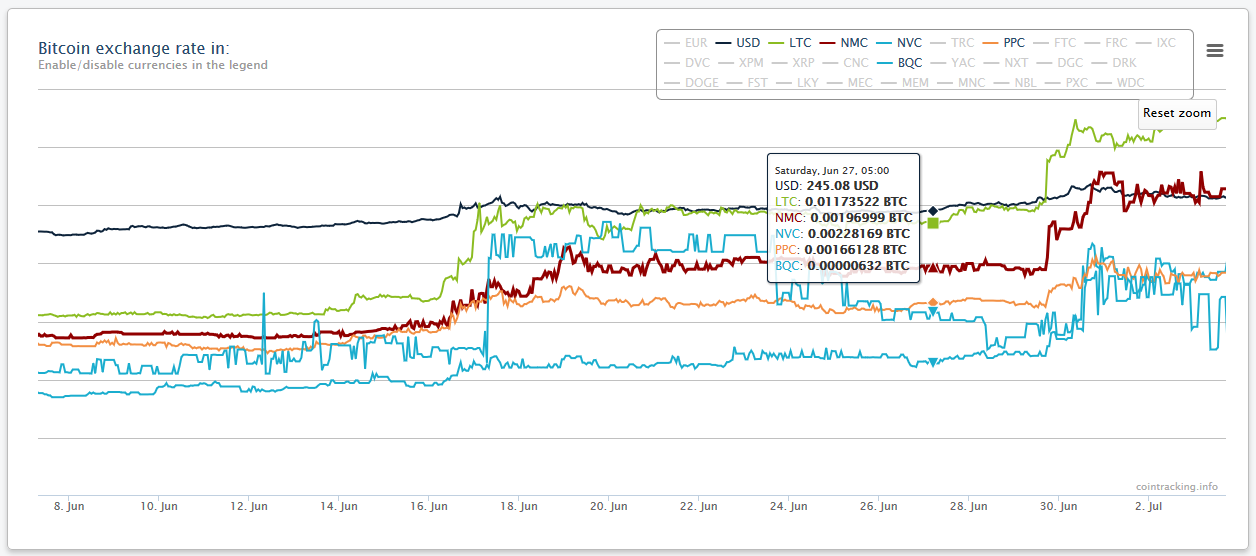
Coin Charts represent the price development of major Coins and FIAT currencies.
By the tabs on the top of the page, all coins can be shown separately or together in one chart.
It is also possible to analyze the price development of FIAT currencies in relation to the Bitcoin price.
Your own Trades are displayed as bubbles in the chart. (Purchase in green and a sale in red).
Based on the size and positioning of the bubbles, the volume and your purchase or selling price in relation to the regular price can be determined.
Coin Trends
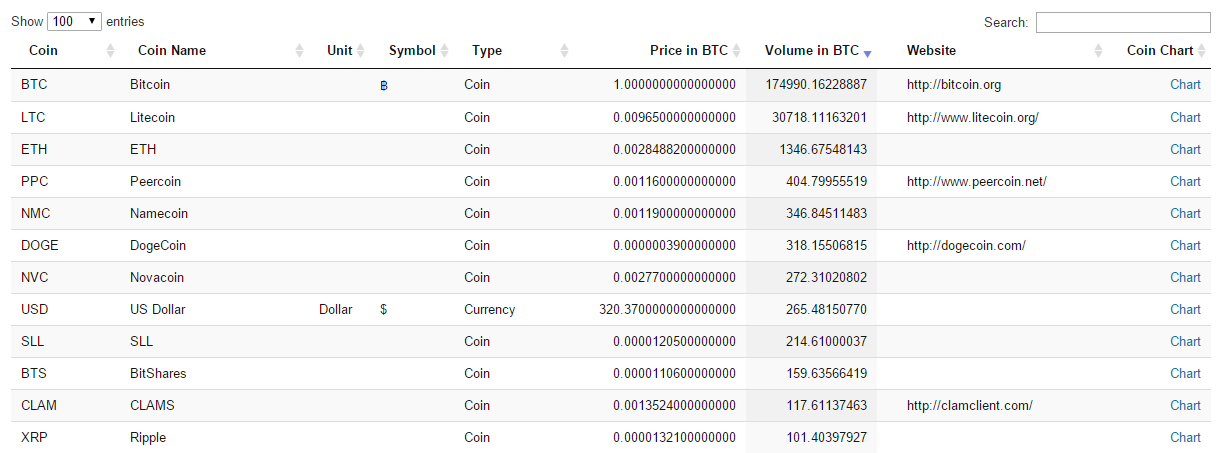
This
All Digital Currencies list includes all 37404 existing Crypto Coins on the market and reflects the current market price and the volume in BTC.
All values are updated every 5 minutes and recently published Coins are automatically added to the list.
Over the Easy Enter form (to which we will come later), all these coins can be tracked and the value plus the spending can be calculated.
What is Easy Enter?
Easy Enter (Enter all Altcoins)
Easy Enter is a system, which allows you to easily monitor all your Altcoins.
It contains prices of all
37404 existing Altcoins on the market and adds new Altcoins automatically.
You can find detailed analysis for all your Altcoins in the
Easy Enter Statistics.
Click on the
New Button, to enter your Coins.
Unlike the regular entry of trades, at Easy Enter a trade-date is not required.
All values always represent the current state and can - unlike trades - not be represented as a history chart.
You can optionally set your
Spending in BTC of an Altcoin, to determine your profit or loss with this Coin.
Multiple entries of the same Altcoin will be summarized automatically.
Easy Enter Statistics
Easy Enter Statistics is an analysis of all your, under
Easy Enter, listed Altcoins.
You will find on this page, among other things your average purchase value per coin, the price difference between your price and the current Coin price, your current value per Altcoin and (provided that the spending in Bitcoins has been specified on the Easy Enter Page), the profit or loss each Coin.
You can find additional information about each of the
37404 currently existing coins on the
Coin Trends page.
Advanced Features
Export of trades
All trades can be exported. To do so, go to the
Transactions page and click the
Export button.
Here you can export your trades into Excel, CSV or PDF, and print or copy them to the clipboard.
On the
Trade Export page, you can also export all trades into HTML, or as Unlimited user into JSON and XML.
XML export data can be reimported in any CoinTracking account via the XML Importer.
Delete Trades
You can delete your trades also on the Transactions page. Selecting a trade and clicking on
Delete, will remove this trade.
You can select multiple rows at once (even across multiple pages) using SHIFT + CLICK or CTRL + CLICK.
Right next to the Trade Table, there is the possibility to delete all trades from an exchange at once.
Here it is also possible to delete all trades in a given period, or to remove your entire trades.
To delete trades in a specific time period, first select the checkbox for the trades you want to delete (for example
delete all trades, or
delete only Kraken trades) and then the checkbox for the time period. Select the time period and click on
delete selected trades.
Change Currency
You can change your primary currency in the
settings. You can choose between currently 17 FIAT currencies.
Set Bitcoin price of another exchange
We use average prices for all our calculations. If you want, you can switch your account exchange rate in the
settings.
Currently the selection of any other exchange is only possible for EUR and USD. We offer Average, Bitstamp, CampBX and BTC-E for USD and Average, Bitcoin.de and BTC-E for EUR.
Change Time Zone
Open the
settings and change your time zone according to your location.
Link multiple accounts with each other
You can join multiple accounts together on the
settings page.
This can be beneficial if you want to track the accounts of friends or clubs. You can switch with just one click in the header (top right of every page) to your other account without having to re-login.
reasons for multiple accounts:
- Improved overview: One account for permanent coin investments (i.e. coins that are not sold over the years) and a second account of daily trades
- Multiple currencies: One account for EUR and one for USD
- Management of coins of friends, acquaintances, the club, etc.
Delete an Account
You can delete an entire account on the
settings page in the right box. Click on
Delete this account to delete this account including all data and trades. Deleted accounts can not be recovered.
My question is not listed here
You can not find the answer to your question in this documentation?
No Problem! Look briefly at the
FAQ if you can find the answer there.
If not, you can contact us using the form at any time. We will answer all questions as soon as possible.
Deutsch
Español
Français
Italiano
Polski
Português
भारतीय
Pусский
Suomi
Türkçe
tiếng Việt
한국어
中文
Dark mode


